In this post, I’ll take you through two interactive dashboards I built as part of Maven Analytics challenges:
“The Pixar Vault: Legacy Unlocked (1995–Present)” — exploring Pixar’s cinematic journey
“Expedition Analysis of Adventure Works” — a Power BI sales performance suite for a manufacturing leader
Both projects use datasets provided by Maven Analytics and are live on the Maven Analytics portfolio platform. Let’s dive in!
 The Pixar Vault: Legacy Unlocked (1995–Present)
About this project
Unlock the secrets of Pixar’s cinematic journey with “The Pixar Vault: Legacy Unlocked (1995–Present).” This immersive dashboard brings together interactive charts and detailed financial insights to explore Pixar’s evolution—from box office highs to critical acclaim.
Tools & Data
Power BI for dashboard design
Dataset from Maven Analytics (Pixar film budgets, revenues, ratings, awards)
Approach
Data Prep: Cleaned budgets and box‑office figures, standardized currencies, filled missing values.
Enrichment: Joined film metadata with Rotten Tomatoes, IMDb, and Metacritic scores.
Design:
KPI cards at the top (Avg. RT Score, Avg. IMDb, Avg. Metacritic)
Line chart tracking annual box‑office revenue
Bar charts for genre popularity and runtime distributions
Scatter plot of budget vs. profit with “Inside Out” highlighted
Dashboard Screenshot

Key Insights
Box Office Trends: Post‑2020 dip and strong 2024 recovery.
Critical Acclaim:
Rotten Tomatoes Avg. Score: 88.36 (7,667 reviews)
IMDb Avg. Score: 7.54 (15M+ ratings)
Metacritic Avg. Score: 78.14 (1,217 reviews)
Awards & Runtime:
PG‑rated films win more awards despite fewer releases
No clear correlation between runtime and success
Budget vs. Profit:
“Inside Out” tops profit charts
Biggest losses: “Onward,” “Turning Red,” “Soul,” “Luca”
Recommendations
Maximize Awards Potential: Focus on PG‑rated titles.
Data Completeness: Ensure all films (e.g., “Luca”) are fully represented for accurate trends.
 Expedition Analysis of Adventure Works
About this project
“Expedition Analysis of Adventure Works” is a dynamic Power BI solution designed to transform raw sales data into actionable insights for a leading manufacturing enterprise.
Tools & Data
Power BI (data modeling, DAX measures, interactive visuals)
Maven Analytics Adventure Works dataset (Sales, Products, Geography, Dates)
Approach
Data Preparation: Used Power Query to create calculated columns and convert numeric fields to categorical buckets.
Data Modeling: Established table relationships in the Model View.
DAX Calculations:
Created measures for Total Revenue, Year‑over‑Year Growth, and Category Shares.
Dashboard Development:
Four linked report pages with custom tooltips
KPI cards and gauge visuals for targets
Geospatial map of sales by state
Treemap for product category breakdown
Time‑series line charts for monthly revenue trends
Dashboard Screenshot
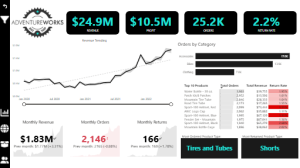
Key Insights
Total Revenue: $24.9M
Top Category: Accessories lead with ~45% of sales
Best‑Selling Product: Water Bottle – 30 Oz
Regional Performance: California and Texas drive majority of sales
 Lessons & Next Steps
Story‑First Design: Always start with your main takeaway in the title and KPIs.
Chart Selection: Use maps for geography, treemaps for category share, gauges for targets.
Data Accuracy: Early data cleaning in Python/Power Query prevents issues downstream.
What’s next? I plan to integrate predictive forecasting (ARIMA models) and add user‑driven slicers for on‑the‑fly scenario analysis in both dashboards.
 Explore & Connect
 View The Pixar Vault on Maven Analytics
- View Adventure Works BI on Maven Analytics
Enjoyed this walkthrough? Leave a comment below or connect with me on LinkedIn. Stay tuned for more data adventures!